The latest statistics for marriage and divorce provide valuable insights into family and social trends for New Zealanders. New Zealand divorce rate trends can be broken down according to specific criteria for a more in-depth look.
Data relating to the divorce rate in New Zealand is provided by Stats NZ Tatauranga Aotearoa, the official government agency in charge of gathering and collating data.
What is the New Zealand divorce rate?
The latest divorce rate in New Zealand is 7.6 divorces per 1000 marriages. This represents the lowest New Zealand divorce rate in the last four decades, according to the latest official figures from 2020.
These are the most recent annual divorce and marriage figures for New Zealand:
- 7,707 divorces in total.
- 16,779 marriages in total.
- Divorces saw a decrease of about 10% year-on-year.
- Marriages saw a decrease of about 15% from one year to the next.
These significant decreases have been attributed to the impact of pandemic restrictions in New Zealand.
What is the major cause for divorce in New Zealand?
The major cause for divorce in New Zealand is that the marriage has broken down irreconcilably. This is the only legally recognised cause by divorce law in New Zealand. However, NZ psychologists have identified the following common reasons for an irreconcilable breakdown of a marriage:
- Lack of intimacy
- Infidelity
- Financial differences and disagreements
- Addiction and abuse
Average divorce rate in New Zealand
The average New Zealand divorce rate can be examined according to different demographic categories.
Average divorce rate by age
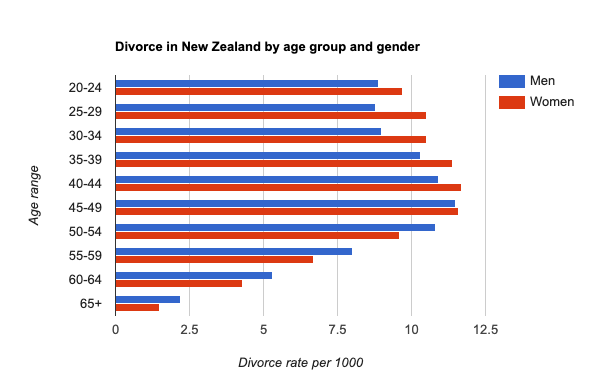
The average divorce rate in New Zealand varies across age and gender. The data below shows the average divorce rate for men and women in each age group. This divorce rate is calculated against the average number of married men and women in each respective age group.
| Age group | Divorce rate for men | Divorce rate for women |
| 20-24 | 8.9 per 1000 | 9.7 per 1000 |
| 25-29 | 8.8 per 1000 | 10.5 per 1000 |
| 30-34 | 9.0 per 1000 | 10.5 per 1000 |
| 35-39 | 10.3 per 1000 | 11.4 per 1000 |
| 40-44 | 10.9 per 1000 | 11.7 per 1000 |
| 45-49 | 11.5 per 1000 | 11.6 per 1000 |
| 50-54 | 10.8 per 1000 | 9.6 per 1000 |
| 55-59 | 8.0 per 1000 | 6.7 per 1000 |
| 60-64 | 5.3 per 1000 | 4.3 per 1000 |
| 65+ | 2.2 per 1000 | 1.5 per 1000 |
These figures clearly show how different age groups contribute to the overall New Zealand divorce rate. Men and women in their mid-50s and older are much less likely to seek divorce.
New Zealanders, on average, choose to marry at 30.6 years old for men and 29.5 years old for women. This is consistent with an ongoing trend where couples are choosing to get married later in life.
Marriages in New Zealand last an average of 13,4 years, according to the latest numbers. This average marriage duration has remained stable over the past decade. The median age of divorce currently stands at 46,8 years old for men and 44,4 for women.
The latest figures also show that 38% of marriages end before reaching their silver anniversary (25 years). The proportion of divorce before 25 years of marriage has been gradually increasing for the past decade. However, this increase isn’t big enough to change the overall decrease of divorce rate.
Average age divorced New Zealanders get remarried
The average age at which divorced New Zealanders get remarried is 48.45 years old. Divorced men get remarried at 50 years old and women at 46,8 years old, on average.
By comparison, widowed men remarry at a median age of 66.8 while widowed women do so at the average age of 60.
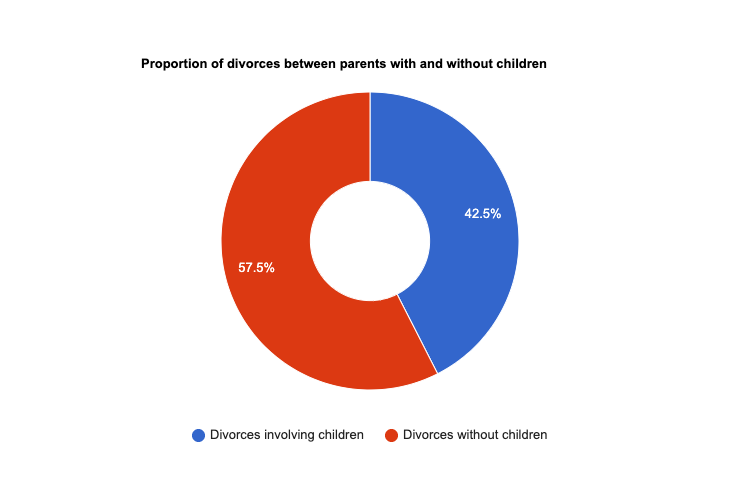
Average divorce rate for couples with children vs couples without children
The percentage of divorce proceedings for married couples with children is 42.5% of total divorces. This results in an average of 1.82 children per divorced household. The latest annual figures show that a total of 5,973 children were affected by divorce. This is less than previous figures which means that a decreasing number of children are impacted by divorce.
The annual divorce totals for couples with children have decreased by around 500 when comparing the latest figures to those from a decade ago. However, the annual number of children impacted by the divorce of their parents has decreased by almost 800 over the same period of time.
How are children impacted by divorce and separation?
Long-term studies of parental separation in New Zealand show varying divorce and separation rates as children grow up:
- 2.3% of marriages ended in the first 10 years of a childhood.
- By age 16, around 34% of children in New Zealand have experienced parental separation or have been born into a single parent household.
According to the Christchurch study, which recorded the home life of 1000 children as they grew up, these are the clear trends when it comes to children and divorce.
- Families with more than one child under five were less likely to divorce.
- Divorce and separation rates were reduced by 40% for families with three or more preschool-aged children.
Other recent studies, such as Growing Up in New Zealand, have shown the significance of divorce for children in New Zealand.
- 5% of 2 year-olds and 8% of 4 year olds live in single-parent households.
- Only 20% of surveyed children had spent their childhood with both biological parents.
The following conclusions can be drawn from the New Zealand Law Commission’s Relationships and Families study.
- Marriage rates have been on a downward trend over the past four decades. Fewer people are getting divorced partly because fewer people are getting married.
- New Zealanders are having fewer children. Fertility rates have halved in the past 60 years.
- The proportion of couples with children is decreasing when compared to other family types in recent household surveys.
Many children in New Zealand experience one or more changes in the makeup of their household during their childhood. This means that the role of marriage, and divorce, is evolving when it comes to having and raising children.
Same-sex marriage and divorce in New Zealand
Same-sex marriage is a recent legal and civil rights development in New Zealand. While civil unions for same-sex couples became possible almost a decade earlier than same-sex marriage, data for same-sex couples is not as rich as data for opposite-sex couples.
The following information and analysis regarding same-sex marriage in New Zealand should be considered preliminary. It will take several decades before enough data is collected to find meaningful trends when it comes to same-sex relationships.
New Zealand celebrated between 402 and 495 same-sex marriages and civil unions according to the latest annual figures collected in 2020. This the lowest number of same-sex marriages and civil unions over the past five years. However, it is too early to get a meaningful understanding of a New Zealand divorce rate for same-sex marriages and unions.
There were 102 divorce proceedings for same-sex couples according to the latest figures. Same-sex divorce accounted for 0.01% of divorces in New Zealand, this past year.

FAQs about divorce rate in New Zealand
These are answers to common questions about divorce rates in New Zealand.
What is the divorce rate in New Zealand?
The current divorce rate is 7.6 per 1000 marriages, according to the Stats NZ government agency.
What percentage of marriages fail in New Zealand?
The latest marriage failure percentage in New Zealand is 0.76%. This represents a 30% drop in the proportion of couples getting divorced, when compared with figures a decade ago. 38% of marriages in New Zealand fail before reaching the 25 year mark.
How long does the average marriage last in NZ?
The latest median duration of marriages ending in divorce has settled at around 13-14 years of marriage. This average figure has remained consistent for over a decade.
How is the divorce rate calculated?
Divorce rate is calculated by dividing total annual divorces by the yearly average of a specific population. For a crude divorce rate (CDR), the population can be the total national average.
For a refined divorce rate (RDR), the annual divorce total is divided by total married women. This method is preferred by some statisticians who see it as more accurate. However, this method does not accurately represent same-sex divorce trends.
Both divorce rate calculation methods generally express results in the form of divorce instances per 1000. You can see these in the New Zealand divorce rate breakdown above.
New Zealand divorce rate: Final words
While divorce rates are decreasing, the impact of a marriage breaking up is no less significant. The statistics on this page give insights on a national scale. However, they don’t account for personal consequences or how to move on from divorce. Our guide on what comes after divorce has advice on the steps you can take to help you with what comes next.